Abstract. The location, timing, spatial extent, and frequency of wildfires are changing rapidly in many parts of the world, producing substantial impacts on ecosystems, people, and potentially climate. Paleofire records based on charcoal accumulation in sediments enable modern changes in biomass burning to be considered in their long-term context. Paleofire records also provide insights into the causes and impacts of past wildfires and emissions when analyzed in conjunction with other paleoenvironmental data and with fire models. Here we present new 1000 year and 22 000 year trends and gridded biomass burning reconstructions based on the Global Charcoal Database version 3, which includes 736 charcoal records (57 more than in version 2). The new gridded reconstructions reveal the spatial patterns underlying the temporal trends in the data, allowing insights into likely controls on biomass burning at regional to global scales. In the most recent few decades, biomass burning has sharply increased in both hemispheres, but especially in the north, where charcoal fluxes are now higher than at any other time during the past 22 000 {years}. We also discuss methodological issues relevant to data-model comparisons, and identify areas for future research. Spatially gridded versions of the global dataset from GCDv3 are provided to facilitate comparison with and validation of global fire simulations.
Citation: Marlon, J. R., Kelly, R., Daniau, A.-L., Vannière, B., Power, M. J., Bartlein, P., Higuera, P., Blarquez, O., Brewer, S., Brücher, T., Feurdean, A., Gil-Romera, G., Iglesias, V., Maezumi, S. Y., Magi, B., Mustaphi, C. J. C., and Zhihai, T.: Reconstructions of biomass burning from sediment charcoal records to improve data-model comparisons, Biogeosciences Discuss., 12, 18571-18623, doi:10.5194/bgd-12-18571-2015, 2015.

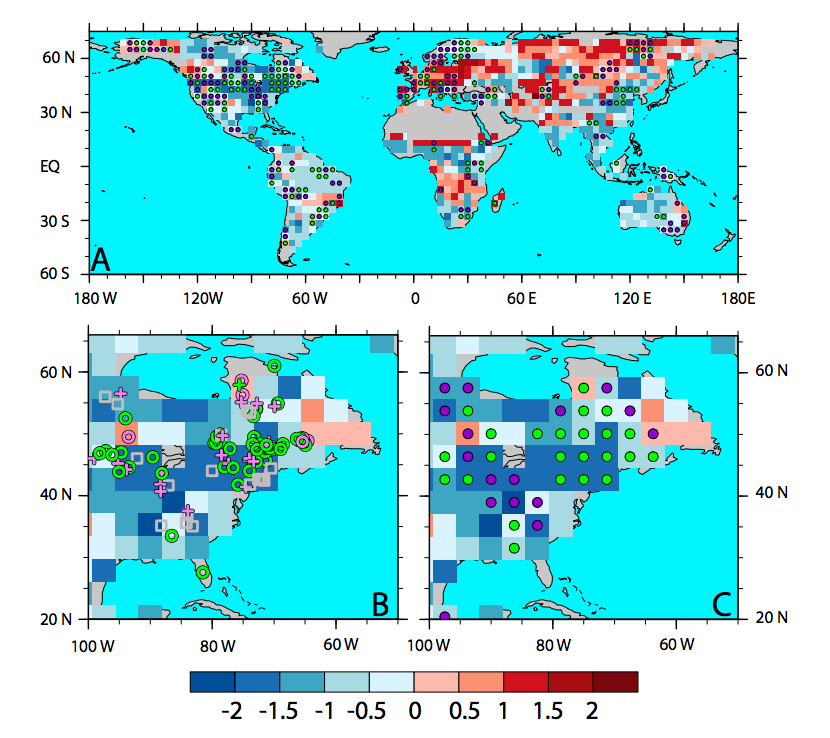
Figure 8. Modeled (filled grid boxes, Brücher et al., 2014) vs. reconstructed (GCDv3) fire activity
at global (a) and regional (b, c) scales. Both data and model represent millennial anomalies
at 6 ka relative to present (i.e., mean z-scores for 5.5–6.5 ka minus mean z-scores for
500 cal yrBP to present). In all panels, green and pink symbols indicate GCD data that agrees
or disagrees (respectively) with model output in terms of the sign of the 6–0 ka anomaly. In (a)
and (c) the data are gridded following methods presented in Sect. 5. In (b), anomalies for individual
GCD sites are plotted, with symbols indicating positive (“+”) or negative (“o”) anomalies;
records that do not span the full 6 ka interval are shown (grey squares) but excluded from the
analysis.